• You can now help support WorldwideDX when you shop on Amazon at no additional cost to you! Simply follow this Shop on Amazon link first and a portion of any purchase is sent to WorldwideDX to help with site costs.
  • A Winner has been chosen for the 2026 July 4th Retevis RA89R Giveaway! Click Here to see who won!

Smith Chart video.


I think most people avoid smith charts because they think it will be akin to learning calculus.

This is one part of the radio hobby that can be learned with just a picture book. Some really basic rules control how inductors, capacitors, resistors, transformers, coax etc move the chart. Its like a slide rule for complex numbers and one doesn't even need to understand complex numbers to use it.

People shy away from complex numbers because they assume it is difficult. Smith charts were invented specifically to make it easy for everyone to solve matching problems without a calculator. Its the ultimate cheat sheet. Edit: and if your eyes are bad, you have simsmith, you can do it on the screen.
 
The Slinky demo reminds me of Physics class where Slinky's were used to show that different waves pass through each other.

Those guys had fun making that video. How did they print that king-size Smith chart laid-out on the Gymnasium floor? The analogy btwn email Spam and Standing Waves caught me off guard until the Incogni pitch began in earnest.

Good instructional vid. Worth watching.
 
Last edited:
Its interesting that this video starts out with how the chart was made (had to pause it at 52 seconds lol). The first smith chart I ever had I made in solidworks because I couldn't find any in vector format. Now I get to go un-pause and see how they did it.
 
  • Like
Reactions: Crawdad
Watched this yesterday. Excellent video. Not just Smith Charts but some good transmission line theory to learn also. Will probably watch at least once more.
 
I have mixed feelings about this video. Not trying to be a troll, but I will explain why I feel that way.

If the intention was to explain how smith charts came to be, this is an excellent video. For a person just looking to learn how to use one in a practical application, I think they missed the mark. I don't think the title should be "The scariest chart in electrical engineering" if they stop short of teaching you how to use it.

In their example, they used a transmission line to bring the complex impedance to a constant resistance circle passing through 1 so that a series reactance could get it to 1. Did they say which direction you must go around that circle? Nope. And although they did technically cover it, I think more emphasis could have been placed on how series and parallel parts move on the chart. The viewer would have had to be following quite well to pick up on that the first time watching.

There was also no mention of the projected scale on the bottom of most smith charts, no mention that one doesn't even need the admittance chart to do the parallel components (although smith charts exist with both impedance and admittance for your convenience eliminating the ruler and compass), no mention of plotting coax loss, no mention of Q (the further from the center, the more things change with frequency) etc.

I hope there is a part 2 to that video that focuses on the how while leaving out all the unnecessary "what for and why". They probably didn't bother because so many other videos cover it.
 
  • Like
Reactions: Cable Guy
Another thing the video made no mention of is conjugate matching. It's not an issue when the target is purely resistive like 50ohm, you just go to 50ohm, but if your target impedance has reactance, you cannot target that point, you must go to its conjugate (flip the sign of your target X) so that the two cancel when connected.

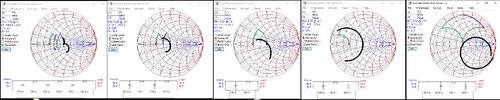
Regarding the bandwidth comment I made above. I got bored and opened multiple smith chart programs, set each to the same center frequency (30MHz) and same span (30MHz) and same impedances (20Ω transformed to 50Ω) so we can see how going further from the center makes the match more narrowbanded. The black line shows where the match ends as the frequency is swept. There comes a point when the added component count and the inductor size and loss interfere with your ability to achieve wider bandwidths.
smith Q.jpg
 
I have mixed feelings about this video. Not trying to be a troll, but I will explain why I feel that way.

If the intention was to explain how smith charts came to be, this is an excellent video. For a person just looking to learn how to use one in a practical application, I think they missed the mark. I don't think the title should be "The scariest chart in electrical engineering" if they stop short of teaching you how to use it.
It is very much the first of your choices, it is more of a how it came to be and a simple demonstration. I have not seen any other video from Veritasium that has to do with with radio applications (not saying there aren't others, but I haven't seen them).

In my opinion, the problem people have when it comes to learning Smith Charts is the combination of two things. Most instructional material seems to be at an engineering level, and push forth to fast for most hobbyists to keep up. The other is hobbyists want to do something that is several lessons into learning the smith chart, and thus skip the prerequisites that are needed to understand what they actually want to do, then get frustrated and give up.

I, personally, think that if given smaller steps, and enough practice problems at each step before moving on, that people can work out what is happening beyond just the surface level. I think most everyone is capable of learning the smith chart if they work at is enough and take it slow enough.

I also think, especially in the modern era which is very coax-centric, more people in the hobby learning the smith chart only strengthens the hobby as a whole...


The DB
 
hobbyists want to do something that is several lessons into learning the smith chart, and thus skip the prerequisites that are needed to understand what they actually want to do, then get frustrated and give up.
This is where I kinda feel different about it because I have done it that way from the start.

Sometimes learning how to use a tool is more important than knowing how that tool was made. When I read a textbook, I will read the first paragraph or two of every chapter and then go back to the beginning. It is all too common for educational literature to reference something that has not yet been learned and sometimes skipping ahead first gives insight into knowing where to look later when that subject is referenced.

I say first walk through a few examples and then explain the details after as it will bolster interest and add confidence to the material being learned.

Consider that video starting with the statement "setting aside the confusing stuff, series components follow the lines that all pass through the right side of the chart and parallel components all follow the lines that pass through the left side of the chart. Inductances move up them, capacitances move down them. There is no need to use words like impedance or admittance to get that point across, yet time and time again, good prerequisite knowledge is not offered. Consider also how this video says the admittance is 1/Z. That statement is true, but it doesn't tell you that 1/Z is not the same as 1/R+1/X. Not understanding complex math makes that 1/Z statement a total mind-fuck for the uninitiated and, IMHO, it shouldn't even be included in an introductory video like this. That, and all the mathematical foundation, should be in part 2.

I guess my brain just works differently
 
--Re-wrote this post after your last post, its a lot more... gentle now... I was rather blunt in the first writing.

Hey brandon, I get your enthusiasm, but sometimes its best to let people be interested. I to like Smith Charts, but sometimes to much is to much.

Think of if this video as history with a non-technical example. Its not meant to teach, just explain what something is to someone who has no technical knowledge whatsoever. I just wanted to implant the idea that this tool exists and can be useful, not teach the tool. Also I figured some people would find it interesting, and some did. Also consider that the people who made the video made it with the purpose of getting clicks on what is essentially a mild science youtube channel.

There are several areas of the hobby that I think more knowledge being out there would be beneficial to the hobby as a whole, The Smith Charts is definitely one of them.


The DB
 

dxChat
Help Users
  • No one is chatting at the moment.