This guy came with some real genius here.
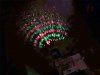
He was able to use some simple gear and come up with the means to see the peaks and valleys in a 2.4gHz CW mode signal.
The red light that you are seeing is the peak of the wave, while the green represents the negative peak. So from each red band to the next, you have one complete wavelength.
Can you eventually see the potential here? If one can get more different colors in between the red and green; then one can eventually see the entire wave as it is propagating.
If you watch the video, you can see just how he arrived at his find.
Any one with a background in electrical engineering can reproduce the same result. But more than that, it is fair enough to watch and see what we know is there. We have to believe it is there first, and the means to quantify it and realize came after.
Anyway, I thought it was very cool.
Enjoy . . .
MAKE | Seeing EM Waves With a Single LED