I just added a new POTA View to the site.
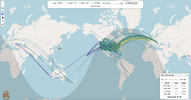
It visualizes Parks on the Air activations from the last 6 hours, with a cap of 1,000 reports. Each activation is plotted by callsign, grid, and park reference. You can pan around the world to see where parks are currently active, or filter by band/mode like in the other views.
Unlike the other propagation maps, this one’s not about signal paths — it’s purely about who’s activating and where. It’s meant to be a quick visual tool for spotting POTA activity at a glance.
You’ll find it in the top-left view selector dropdown (just choose “POTA”).
As always, the site is free, no login, no nonsense. Built by a ham (me – AK6FP) and evolving thanks to the feedback of others.
Try it out and let me know what you think: https://dxlook.com
73,
Rodrigo – AK6FP